CVB #0010: Hate data? What about listening?

Welcome to CVB Weekly, where every week I will share some of the most interesting learnings, ideas, and news related to building customer value. I look to where the business is going and what you should be paying attention to.
👋 Get CVB weekly on a Tuesday 👋
In Issue #4, we covered off a few of the challenges related to Marketers & business owners seeking to access and action customer data. To save you time, heres a quick recap.
- Data lacks focus. There are so many options that teams often find it hard to take the first step. Issue #6
- The data sits within team Silos. Different teams own different pieces of the data pie making it challenging to collaborate. Issue #4
- Data sits within different technology. There is a growing number of add ons that a team require in order to execute data-driven decision making. Our sources have now grown from 9 to 13 & other businesses will have many more.
- Lack of skills and the imposter monster. Data is not something we are taught as marketers and can feel un-natural and trigger the imposter monster. Issue #3
- Data is not perfect and this can trigger perfectionists to pause rather than continue moving forward embracing uncertainty.
Now we need to start looking more deeply at your data sources as we look at the 3rd challenge on the list - data sits within different technology. In this issue, we will delve into the five key metrics you have at your fingertips for free that will help unify your data sources. I will share the data I report on regularly & why the data is so valuable.

Firstly, let's define the 'data club' rules of play.
- Data is not perfect & is constantly evolving (UA is now changing to GA4)
- You don't need to be a data scientist to use data.
- Get used to using multiple attribution models, as none are perfect.
- Read ALL of your reports and if you have questions, ask them!
- Work with great digital agencies who are willing to collaborate on a shared attribution model (especially important if you have more than one agency)
- Always report using Google Analytics AND on-platform data when you look at your customer data. Never rely on one for perfect attribution.
A quick note on attribution.
It's a murky and challenging business. In short, a platform allows you to set the rules concerning how a sale is attributed. Have more than one agency, and you will likely operate with more than one attribution model. 🤯
In marketing, attribution, also known as multi-touch attribution, is the identification of a set of user actions ("events" or "touch-points") that contribute to a desired outcome, and then the assignment of a value to each of these events. Wikipedia
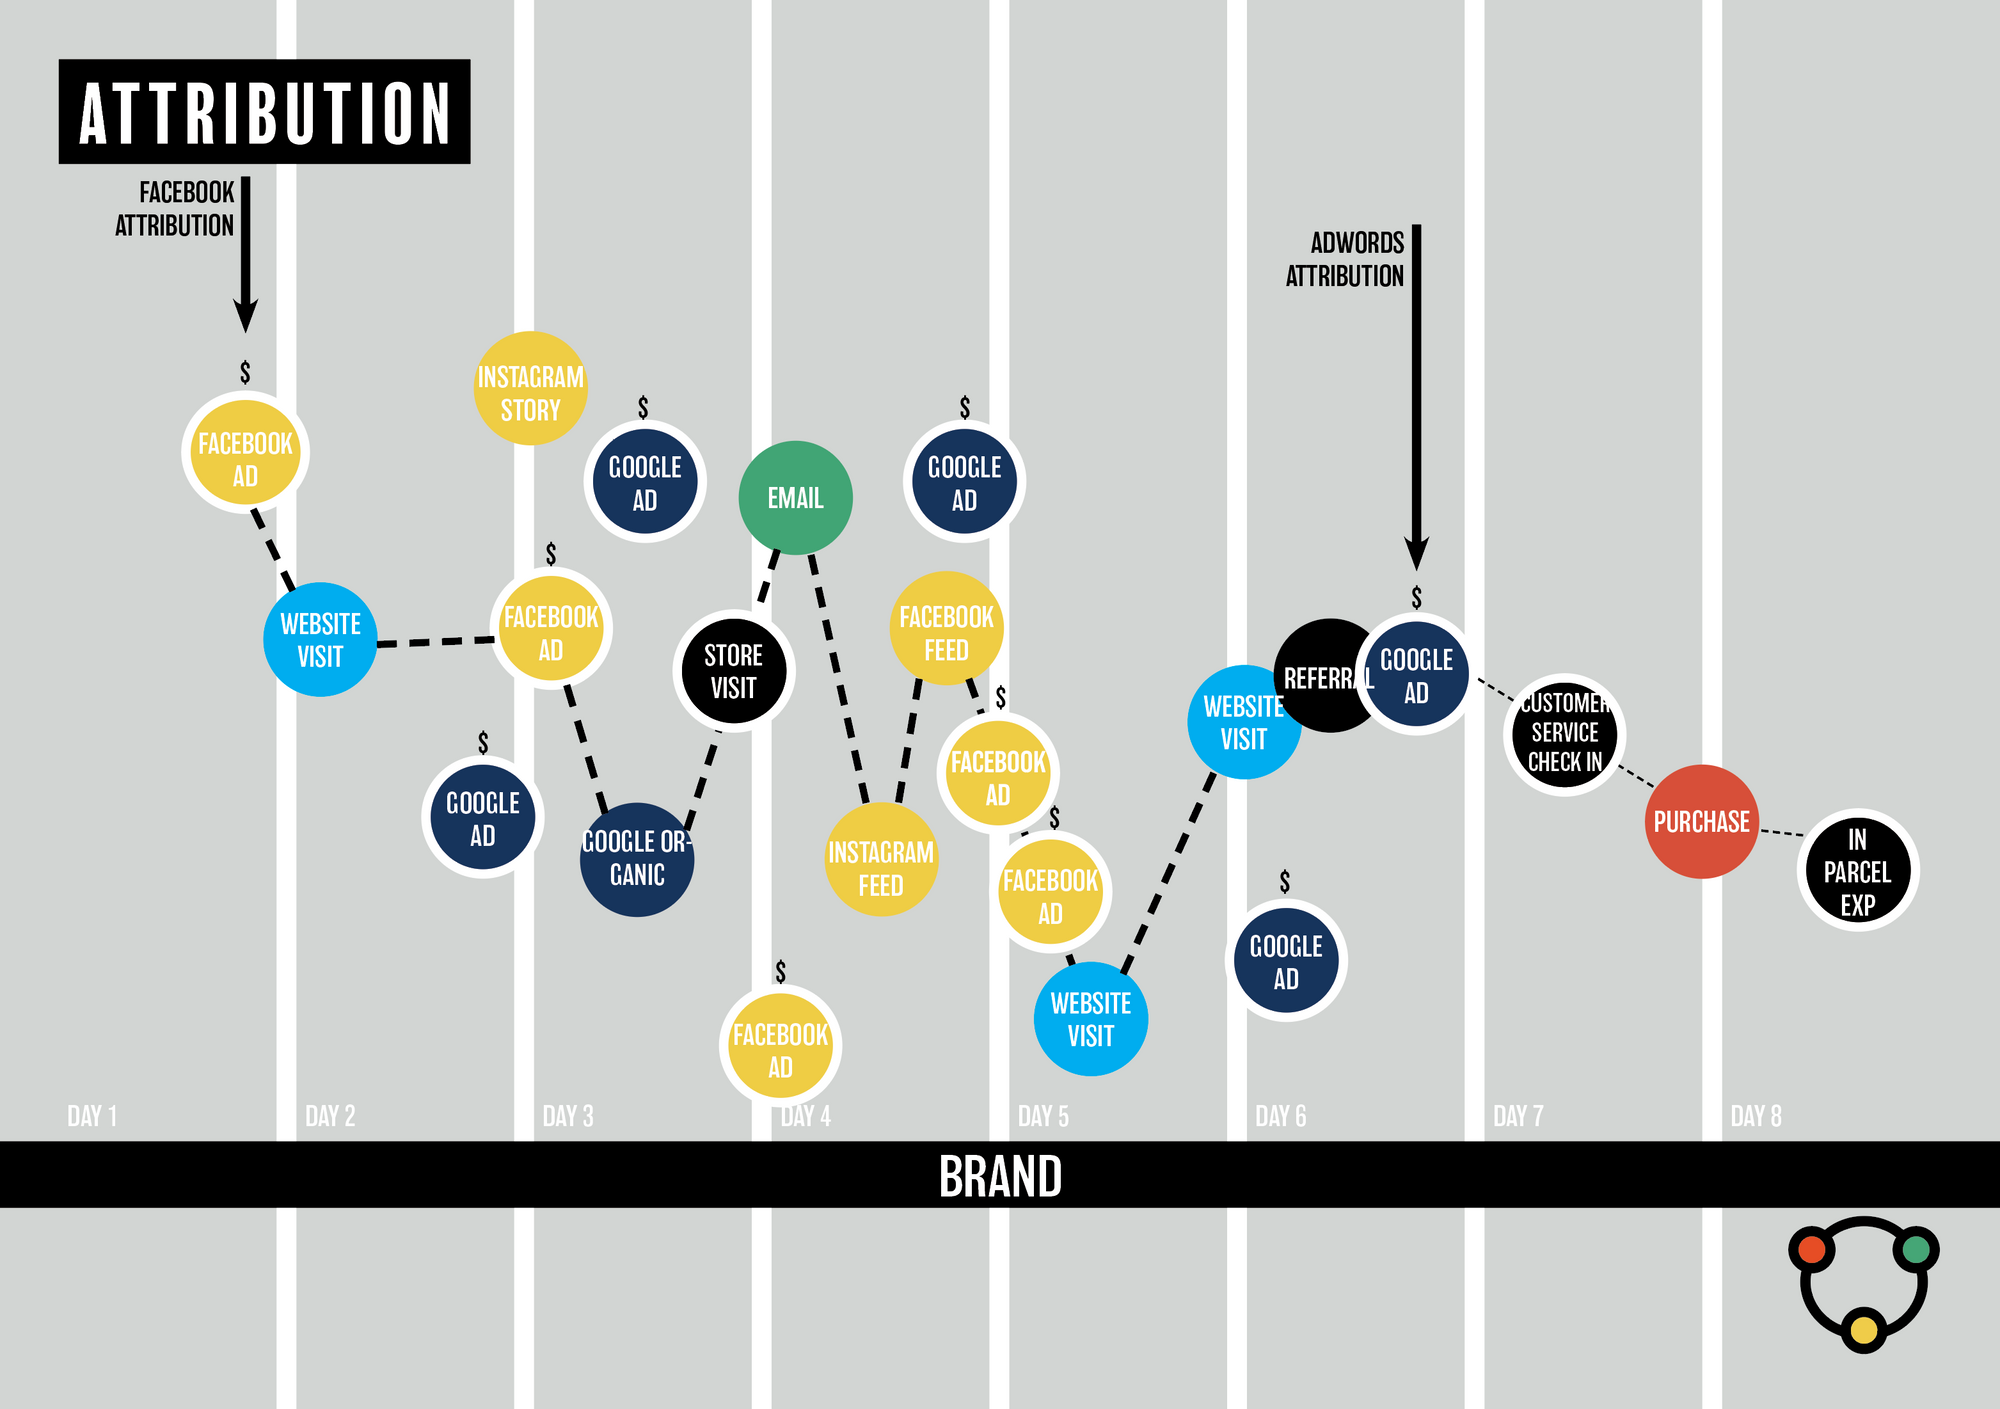
The 'attribution' issue is that customers can have more than 11 touch-points. And some of those touch-points can be owned (and managed by the internal team), and some are paid (and operated by an external agency). Some can be organic and the result of the combined impact of longer term brand building and storytelling.
In the example below, Facebook (META) claims the attributed sale as it is within the seven-day attribution window for Facebook. A consumer could have clicked on any of the other 14 touch-points, but META will claim the attribution. The same goes for Adwords. If the attribution has been set up as 'last click', Adwords will claim the sale.
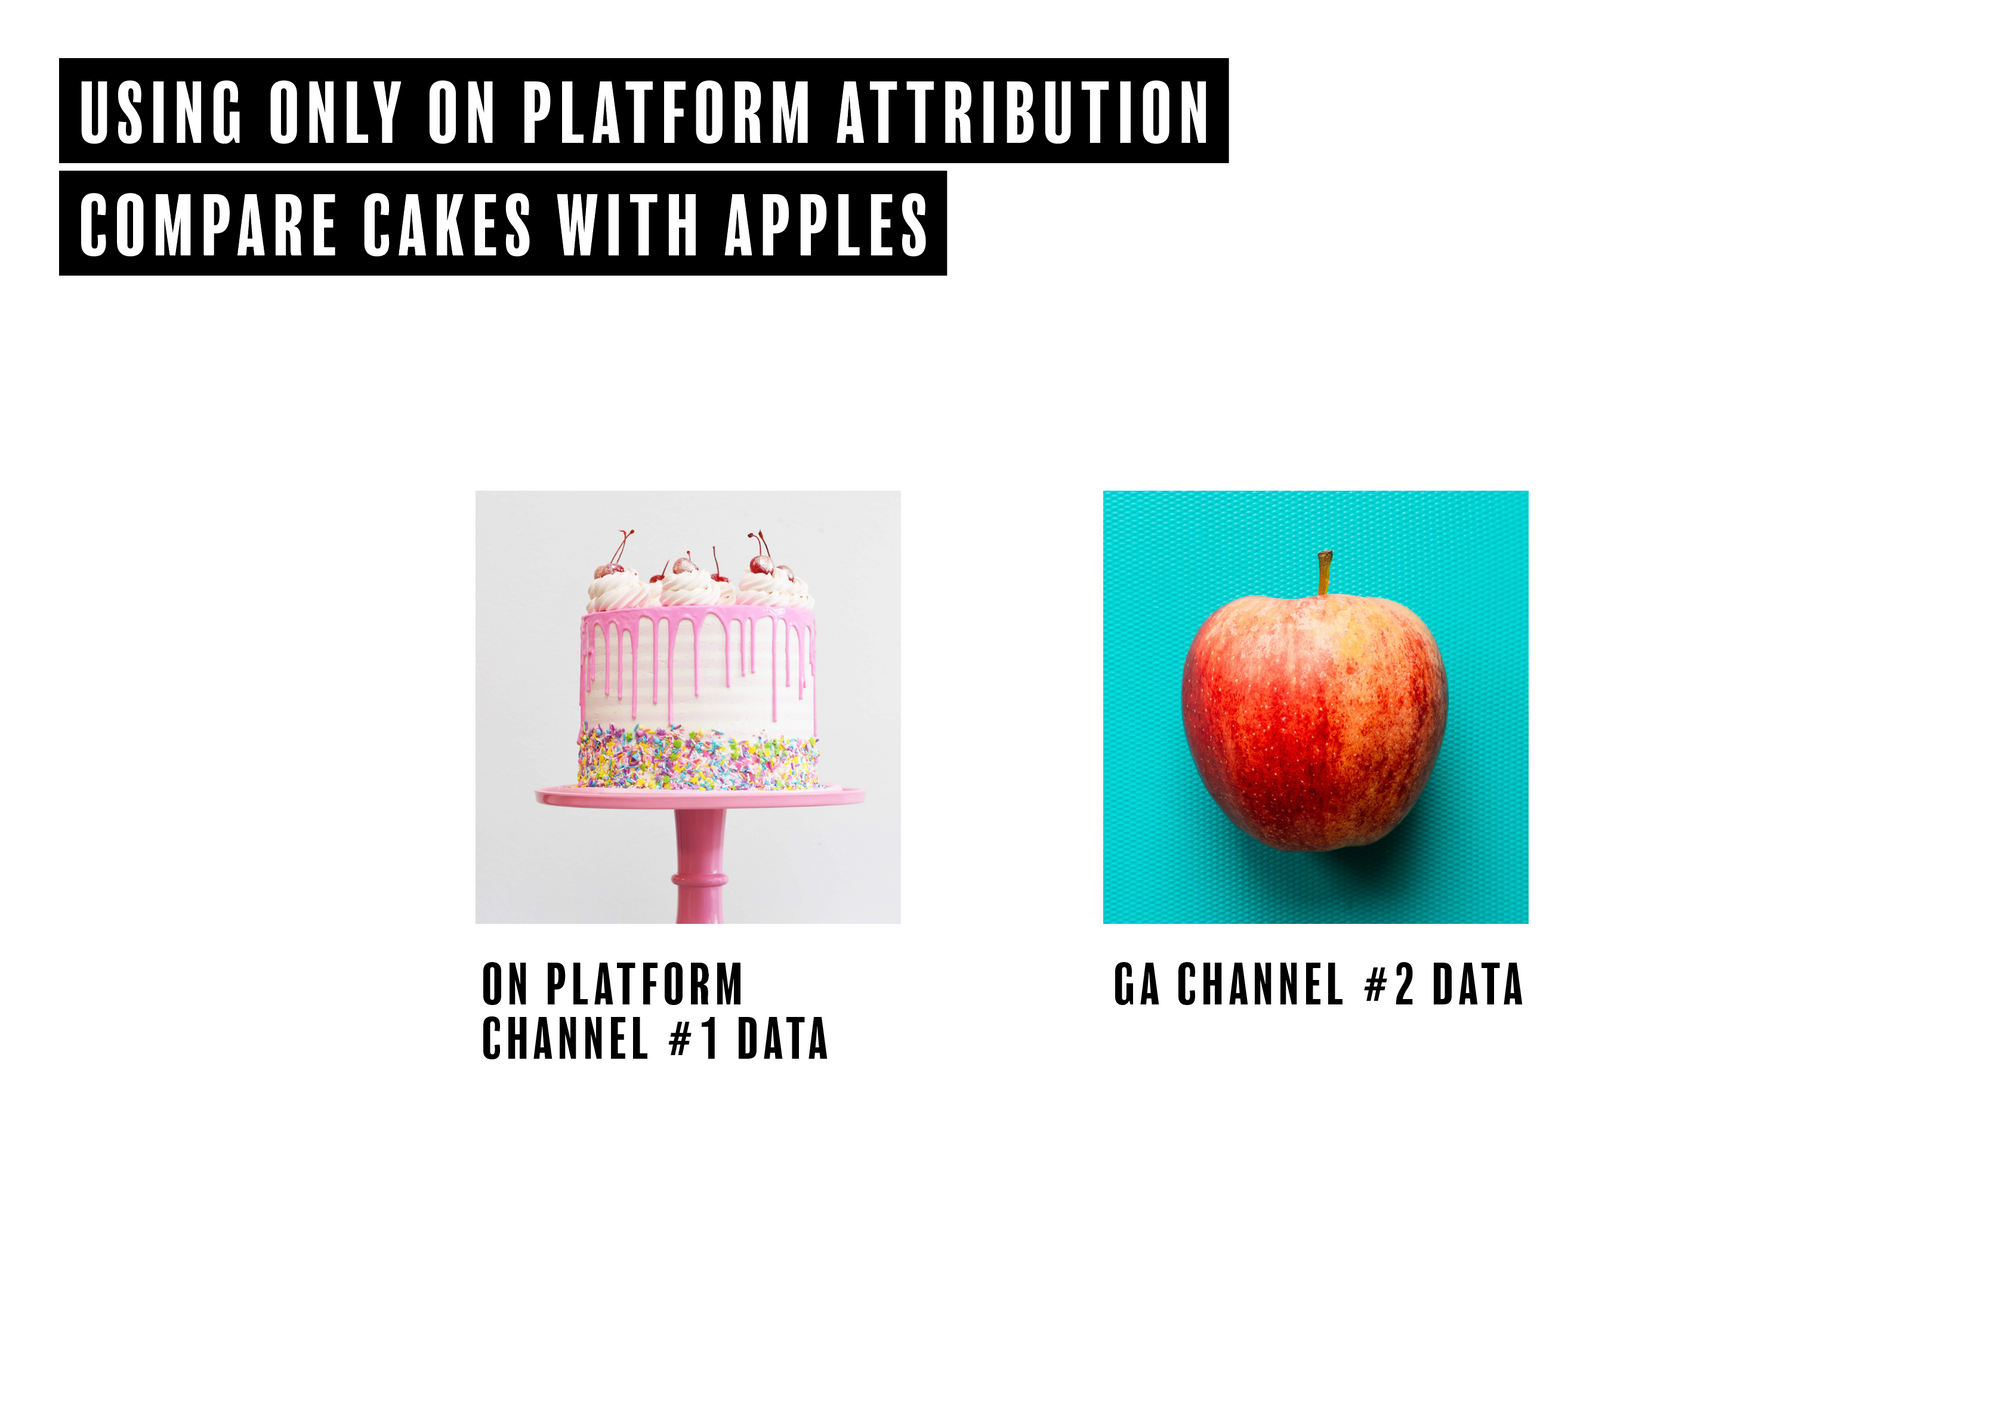
If you focus ONLY on the on-platform reports supplied by agencies, you will see a narrow picture of attribution. This can lead to incorrect budget allocation and an over-reliance on paid advertising.

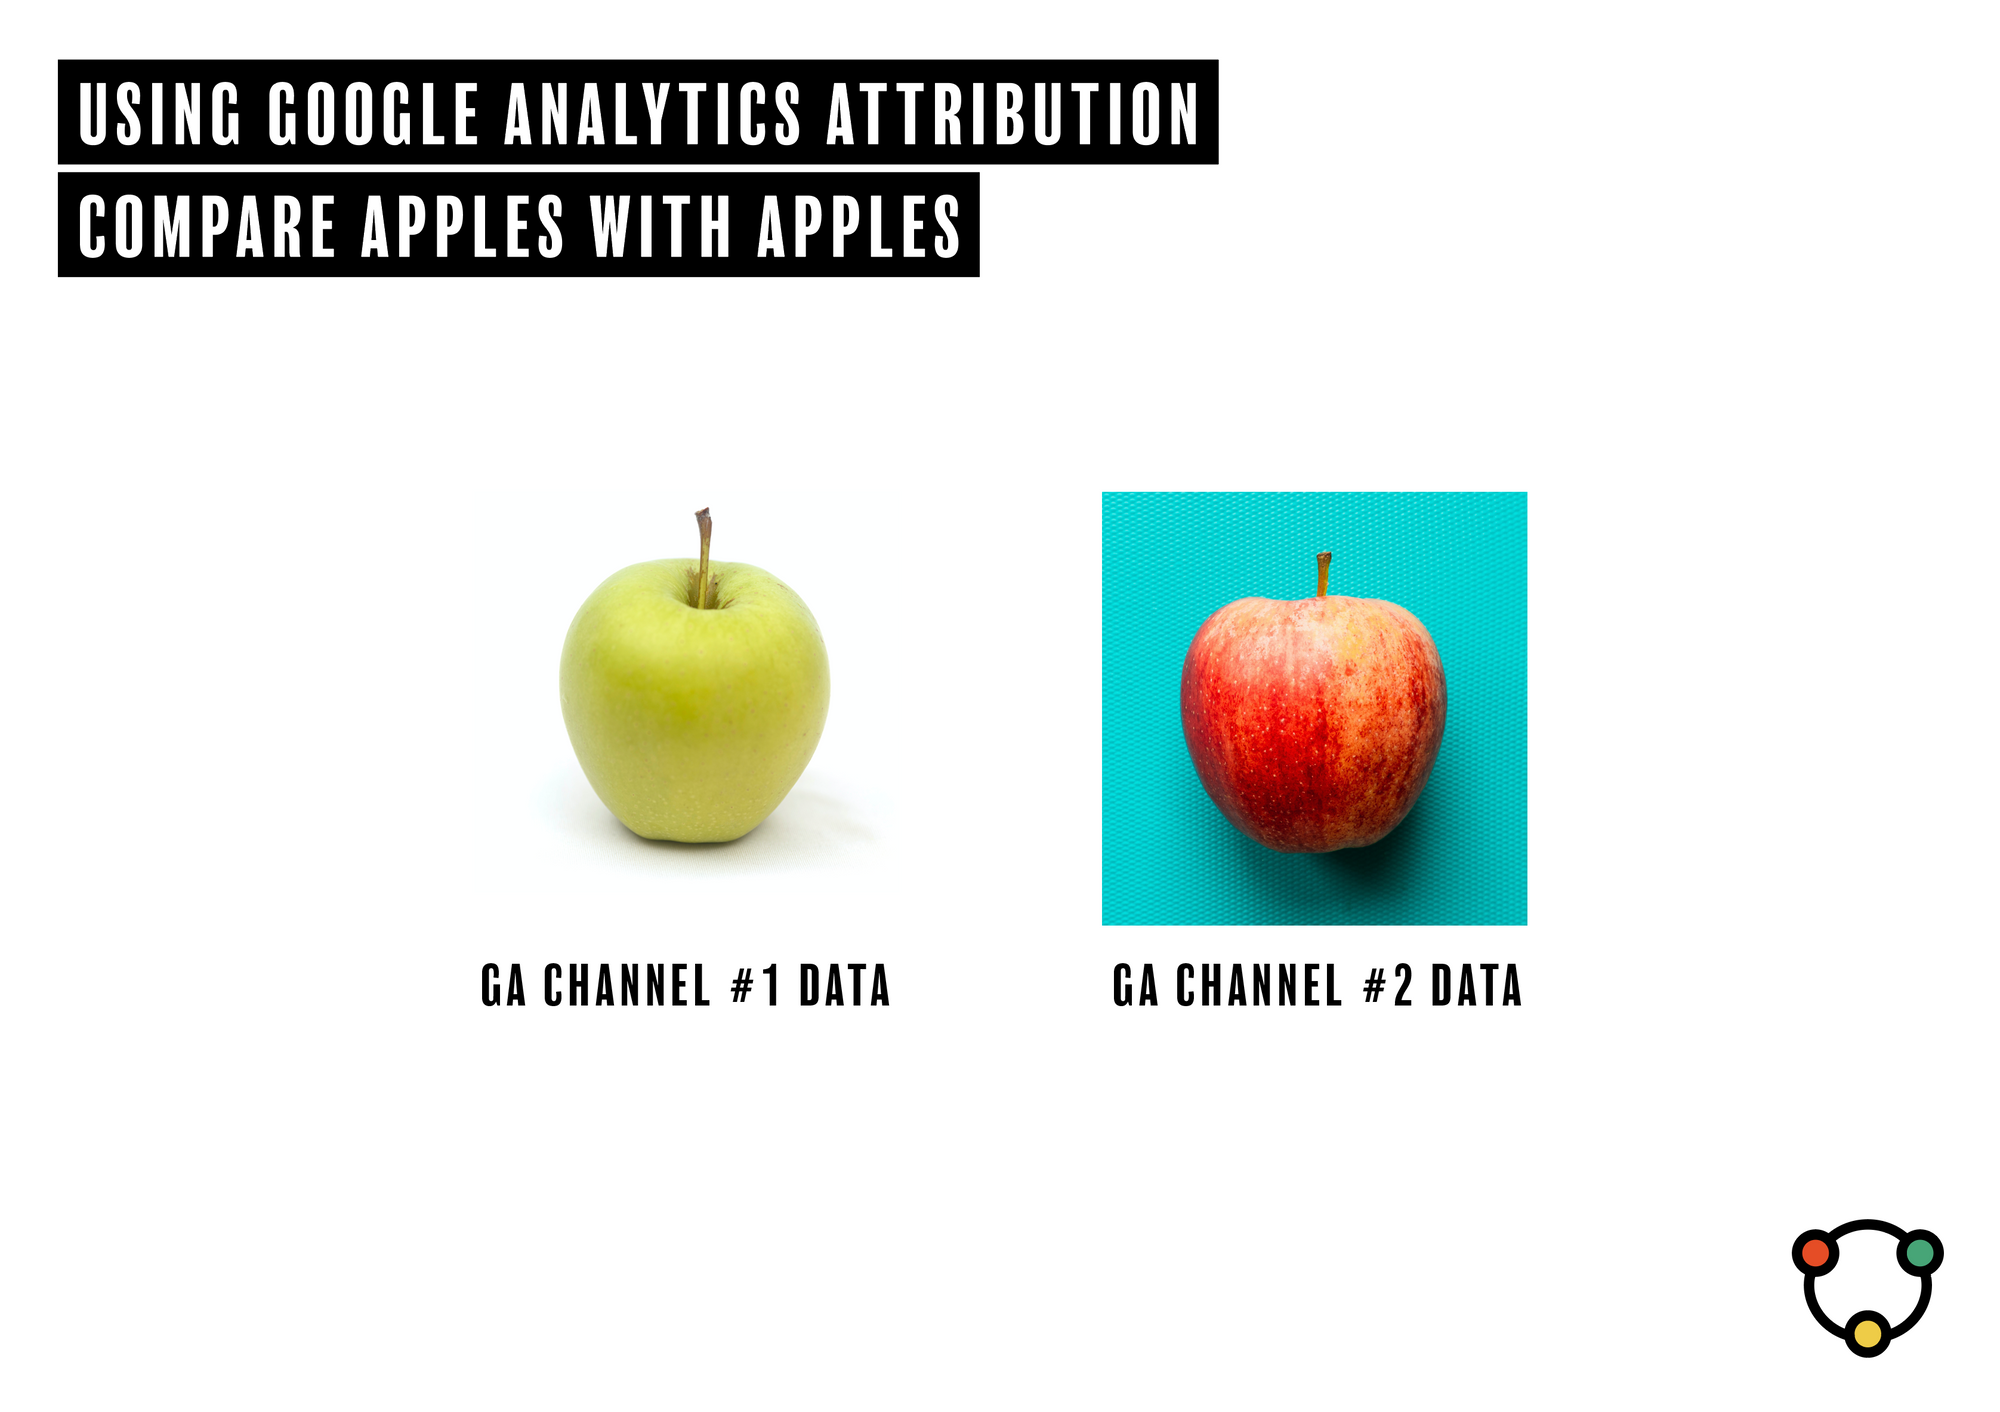
Google Analytics attribution is excellent (but not perfect) as it enables you to compare apples with apples. The business would have tracked the sale twice in the above example (when only reporting from on-platform results). Using GA, you can compare all of your channels in one place. That includes all paid and organic channels.

And understand that on-platform (Adwords and META) and GA will always be imperfect, but once you start tracking weekly data, both sources will give you a sense of performance. You will then be able to run tests to see the impact of each paid channel.

Let's get into the 5 Key Metrics
In Issue #3, I touch on the five I use with clients to track across all strategies, customer groups and channels. This was the advice I got more than ten years ago from a data scientist when I struggled to keep the imposter monster at bay. Let's recap that again here.
- Choose five metrics and don't overthink it too much, as you can add more later.
- Create a discipline by setting a time each week to record the data. My reporting time is 6am on a Monday over a double espresso.
- Make a note of any outliers. Try to consider what might be happening. You may not know the answer, and that is ok.
- Do this consistently. Don't change the metrics but rather add more over time.
- Start to ask questions as you become more comfortable with the data.

- Sessions (this is the number GA uses to calculate your ECR)
- Ecommerce conversion rate/ ECR
- Transactions
- Revenue
- Average order value/ AOV (this is a manual calculation based on total REV/TRANSACTIONS)
Track these 5 metrics for all channels weekly. Do it at the same time (say Monday morning).
Pro tip
In an up-coming issues, I will start to dig into on platform data as we look at additional data sources to build out your reporting template.
🔶 Social data.
🔶 Email data.
🔶 Web data.
🔶 Sales data.
🔶 Paid social data. (Facebook business manager)
🔶 Paid search data. (Adwords dashboard)
If it helps to have a template to use to guide the process, you can upgrade to the paid subscription or keep proceeding.
What do you can do for me
If you value the free advice, share the love on social media or pass the tip on to a friend.
You can also sign up for our 'customer love' program that will hold your hand as you use customer love to grow your business. Coming soon! {if you are paid subscriber, you will be one of the first to learn about it 😉}
Happy Tuesday - thanks for stopping by. 🥰


